LottoMetrics Documentation
Working with LottoMetrics
The LottoMetrics desktop application provides clear tools for analyzing lottery results. Select the lottery you want to explore, apply filters by time period, and access modules designed for transparency and usability.
Frequency Analysis
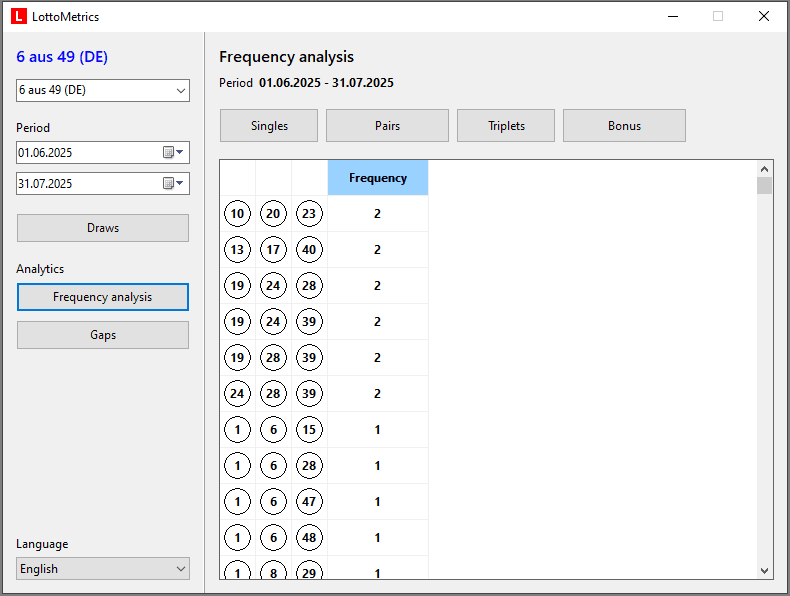
Frequency Analysis shows how often each number has appeared in past draws. It helps identify hot numbers (frequently drawn) and cold numbers (rarely drawn), giving users a clear view of historical trends.
This module highlights long‑term patterns without predicting outcomes, empowering players and researchers to make informed decisions.
Gaps Analysis
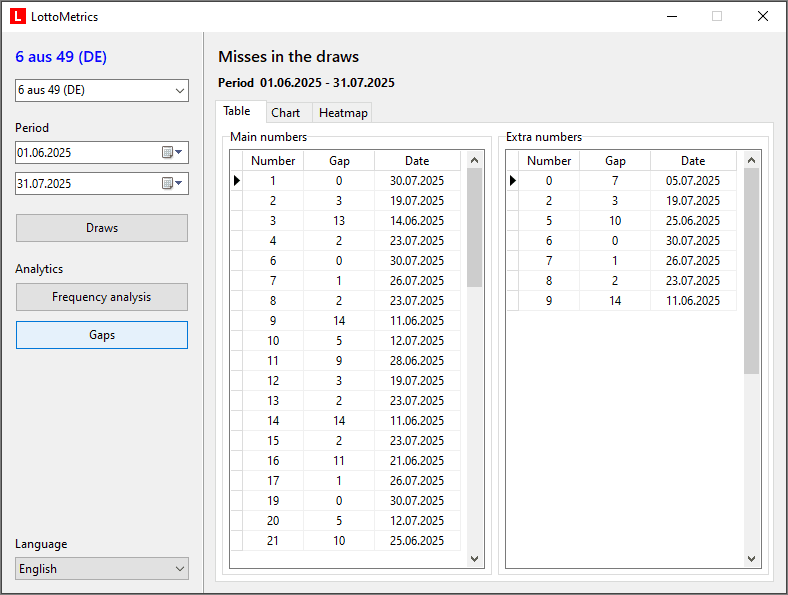
Gaps Analysis highlights how many draws have passed since each number last appeared. It reveals delay patterns and shows how long specific numbers remain absent.
This perspective complements frequency analysis, offering a transparent view of lottery dynamics and absence trends.
Number Rhythm Analysis
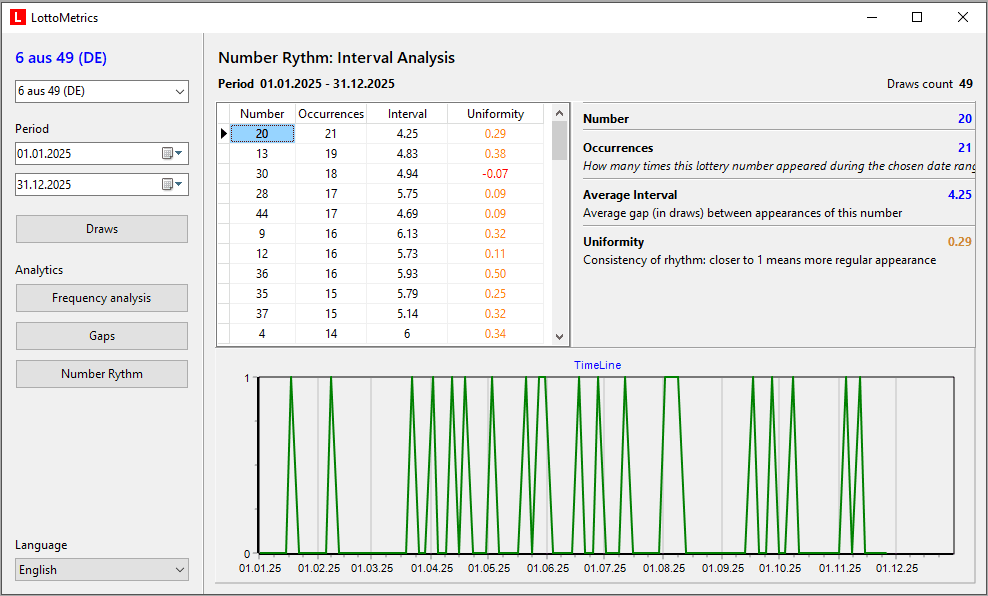
Rhythm Analysis focuses on intervals between appearances of each number. It highlights the natural timing of returns and shows whether numbers follow stable cycles or irregular patterns.
This module helps compare short‑term fluctuations with long‑term rhythms, offering a deeper perspective on lottery results.
Flexible Data Input and Updates
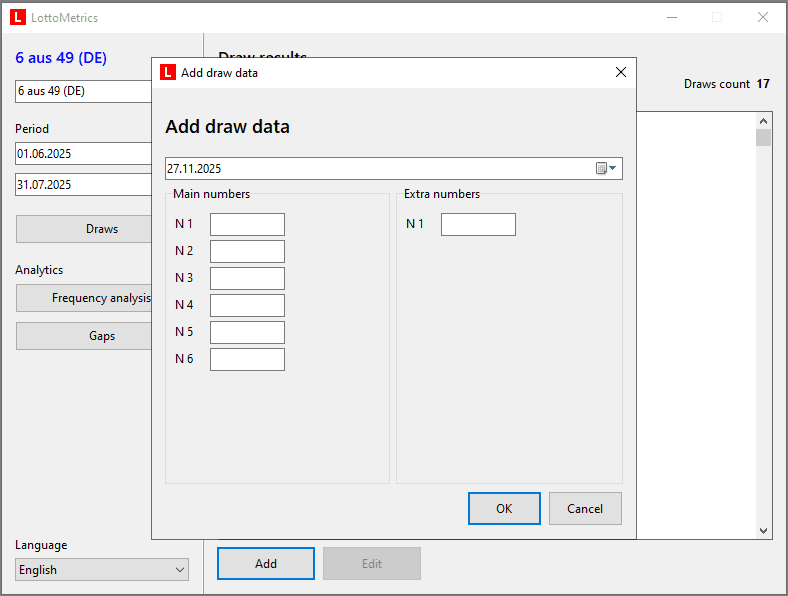
LottoMetrics keeps analytics current with automatic updates from official draw results. If offline, you can manually add or edit data, ensuring continuity.
- Manual entry: add new draws with date and results.
- Editing: correct mistakes in existing records.
- Validation: built‑in checks prevent incorrect data.
- Auto‑sync: manual changes synchronize once connectivity is restored.
This guarantees analytics remain accurate and trustworthy, whether online or offline.